From Near-Death to Complete Recovery:
My Personal Journey Through Aspartame Poisoning
How I Uncovered the Truth That Saved My Life
(And Could Save Yours Too)
From Janet Starr Hull, Ph.D., CN
Survivor, Researcher & Your Guide to Recovery
Dear Fellow Health Seeker,
I need to share something deeply personal with you. Something that changed everything I thought I knew about health, medicine, and the food we eat every day.
The Day My World Collapsed
Picture this: You're sitting in a sterile doctor's office, and three different specialists are telling you the same devastating news.
"You have Grave's Disease. It's incurable. We need to start aggressive treatment immediately."
That was me in 1991.
I remember the exact moment - the fluorescent lights humming overhead, the smell of antiseptic, the way my hands trembled as I gripped the arms of that uncomfortable chair.
The doctors were talking about radioactive iodine, about potentially removing my thyroid, about a lifetime of medications.
I was supposed to accept this death sentence. Just like that.
But Something Didn't Feel Right
Here's the thing about being a researcher - you can't just accept things at face value, even when you're scared out of your mind.
I went home that night and did what I always do when faced with a problem: I started digging. Deep.
I pulled every medical journal I could find. I analyzed my symptoms. I traced back through my daily routines, my diet, my lifestyle changes. And slowly, a pattern began to emerge.
The Breakthrough Moment
It hit me like a lightning bolt at 2 AM on a Tuesday night, surrounded by stacks of research papers and empty coffee cups.
Every single one of my "Grave's Disease" symptoms had started around the same time I'd switched to diet products. Diet sodas, sugar-free gum, "lite" foods - I'd embraced the whole sugar-free lifestyle thinking I was being healthy.
The timing was too perfect to be coincidence.
My Personal Experiment
Against my doctors' advice (they thought I was crazy), I decided to conduct an experiment on myself. I completely eliminated every product containing aspartame from my life and designed what would become the Aspartame Detoxification Program.
Day 1: I felt like I was going through withdrawal. Headaches, fatigue, irritability.
Day 7: The brain fog started lifting. I could think more clearly than I had in months.
Day 15: My heart palpitations stopped. The tremors in my hands disappeared.
Day 30: I went back to my doctors for follow-up tests.
The Results That Shocked Everyone
My thyroid function was completely normal. Every single "Grave's Disease" symptom had vanished.
The doctors were baffled. They ran the tests three times. They brought in colleagues to review my case. According to everything they knew about medicine, this was impossible.
But I was living proof it wasn't.
The Personal Mission That Followed
That experience changed the entire trajectory of my life. I couldn't just keep this discovery to myself - not when I knew there were millions of people out there suffering like I had suffered.
I started counseling others, one person at a time. Sarah from Texas, whose "fibromyalgia" disappeared in three weeks. Michael from Ohio, whose "chronic fatigue syndrome" vanished after following my protocol. Maria from California, whose daughter's "ADHD" symptoms resolved completely.
Nine out of ten people I've worked with have experienced the same miraculous recovery I did. Not because I'm some kind of miracle worker, but because we're addressing the real cause instead of just treating symptoms.
What This Means for You
If you're consuming aspartame and dealing with health issues your doctors can't seem to cure, you might be exactly where I was in 1991 - poisoned by something you thought was helping you.
The difference is, you don't have to figure this out alone like I did. You don't have to spend months researching and experimenting. I've already done that work.
The Aspartame Detoxification Program I developed from my own recovery is the exact same protocol that saved my life and has helped thousands of others reclaim theirs.
My Promise to You
I've dedicated my life to this work because I know what it feels like to be told you're incurable when you're not. I know the fear, the frustration, the feeling that your own body has betrayed you.
But I also know the incredible joy of complete recovery. Of getting your life back. Of proving the "experts" wrong.
That's what I want for you.
To your health!
Janet Hull
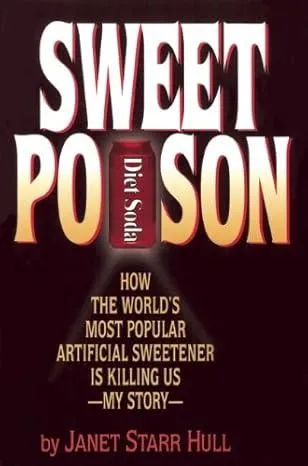
About SweetPoison
Sweet Poison: How the World's Most Popular Artificial Sweetener Is Killing Us - My Story by Dr. Janet Starr Hull is a compelling exposé that chronicles her personal near-death experience with aspartame poisoning in 1991, which led to a grave misdiagnosis of thyroid cancer.
Through meticulous research, Dr. Hull uncovers the hidden dangers of aspartame, a widely used artificial sweetener linked to a range of health issues, including neurological disorders, immune system dysfunction, and chronic illnesses.
The book combines her personal narrative with scientific evidence, detailing how aspartame’s toxic components—phenylalanine, aspartic acid, and methanol—can harm the body, while critiquing the regulatory failures that allowed its widespread use.
Dr. Hull also provides practical guidance on detoxification and natural health alternatives, empowering readers to recognize and avoid this pervasive toxin in everyday products like diet sodas and sugar-free foods.
More About Aspartame Poisoning
About Janet Starr Hull
Janet Starr Hull is a renowned nutritionist and toxicologist who nearly died from aspartame poisoning in 1991, inspiring her to author Sweet Poison and advocate for public health. Read more about Janet Starr Hull.
Connect with Janet Starr Hull on Social Media
Facebook
X
LinkedIn
Youtube